A Gantt chart shows what you're working on and when, as well as how tasks are linked. With Freelo, you no longer need any spreadsheets. The timeline is generated directly from the tasks. Just add due dates, and you'll instantly see the schedule for the entire project.
 The Entire Project Over Time
Relationships Between Tasks
No Excel
The Entire Project Over Time
Relationships Between Tasks
No Excel
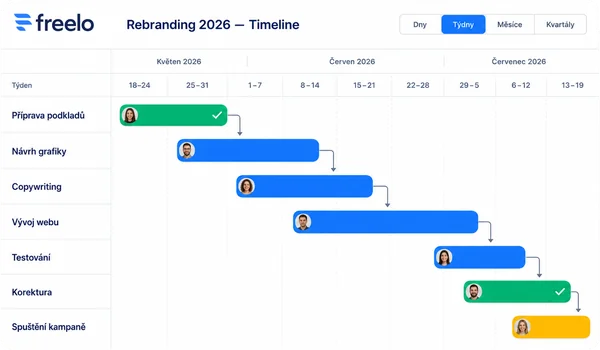
One is in the calendar, another is in my head, and a third is in an email from a client. The overall project plan is nowhere to be found. A Gantt chart organizes all the deadlines onto a single timeline. Just switch the task view to Timeline.
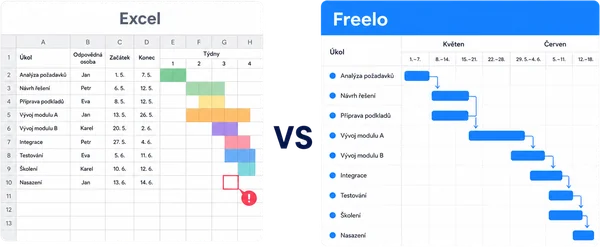
Obarvené buňky, posunuté sloupce, a po každé změně termínu překreslujete celou tabulku. Ve Freelu se diagram překreslí sám. Posunete úkol a vazby zůstanou zachované. Žádné vzorce, žádné ruční přebarvování.
The supplier is running late, and you’re manually tracking down everything that’s been pushed back as a result. Task dependencies show what depends on what, and when you need to reschedule the entire order, you can do it all at once—not task by task.

”Gantt is just one way to view tasks. You can switch to Kanban, a to-do list, a calendar, or a mind map at any time.”
Construction, events, deliveries, and shipping of goods from an online store. When a project has clear start and end dates ( ”) and a deadline (” ), the Gantt chart in Timeline view will immediately show you whether the work can be completed on time and where the biggest risks lie.
A campaign where the graphic design is waiting for the copy, production is waiting for approval, and the entire project is waiting to be launched. A Gantt chart shows who is waiting for what and reveals where the work might get stuck. You can show the client a schedule they can understand right away.
Implementation, recruitment, deadline, product preparation. When you need to see several weeks ahead—and not just ”what to tackle today” —use the Timeline view to open the Gantt chart. This will give your project a timeframe so you know when to add tasks and when things are quiet.
Nastavte úkolu datum od–do a termíny se rázem objeví jako pruh na časové ose. Diagram nestavíte zvlášť. Tvoří se automaticky podle úkolů, které máte ve Freelu. Osu si přepnete podle toho, jak daleko plánujete: dny, týdny, měsíce, kvartály, půlroky i roky. Žádné přebarvování buněk, žádné vzorce jako v Excelu.
Try Freelo for free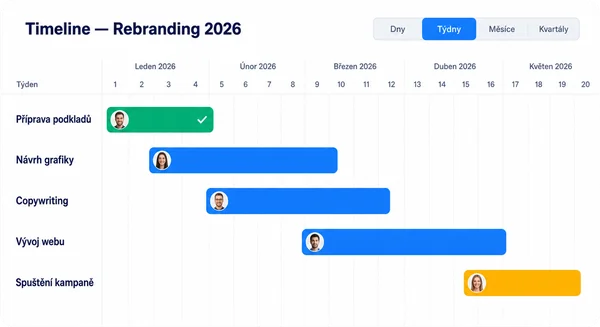
Among the tasks you create a link”"this starts when that ends"” and you can immediately see how the tasks build on one another. It’s not just about individual deadlines. The timeline also continuously shows which tasks the project’s overall completion date depends on, so you have a clear overview of where you can’t afford any delays.
Try Freelo for free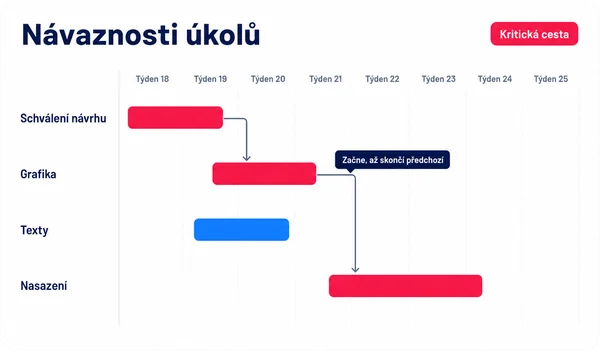
When you select the entire task bar, you can move it to a different date. Drag the edge to extend or shorten the task. If you move the entire project, you don’t have to go through the tasks one by one. You can move hundreds of tasks at once. And for dependencies, you can choose whether follow-up tasks should be moved at the same time or remain in place.
Try Freelo for free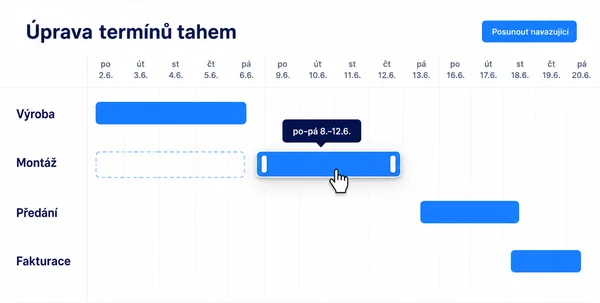
You don’t have to stick to just one project. The Cross-Project Timeline in the Dashboard combines tasks from multiple projects onto a single timeline, color-codes them, and lets you filter to see only what you’re currently working on. This is ideal when you’re juggling several projects at once and want to see where deadlines overlap.
Try Freelo for free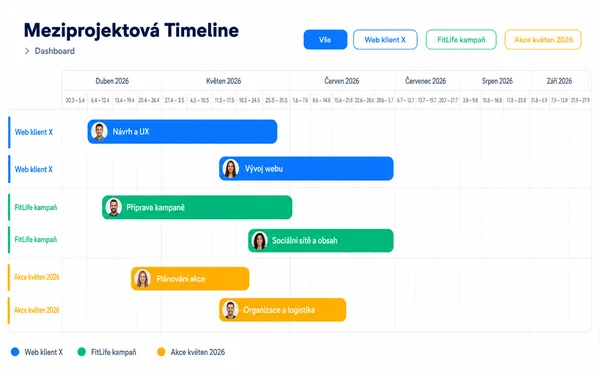
You can view the same tasks as a Kanban board, a to-do list, a calendar, or a mind map. Use Gantt for long-term planning and Kanban for day-to-day work, switching between them depending on what you need at the moment. The data remains the same; only the perspective changes.
See all features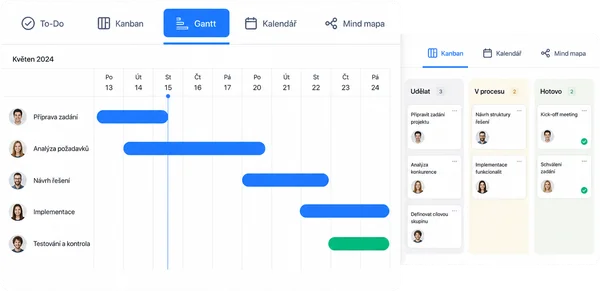
You don’t need training or expensive corporate software like MS Project to use a Gantt chart. In Freelo, Timeline is one of five ways to view your tasks. You can enable it wherever it suits you, and for the rest, you can stick with the list view or Kanban. No need to choose between ”or”.
The task timeline view is included in the Business plan, and you also have access to it during the 14-day trial.
Not sure how to set up the timeline? The TuDů assistant is here to help you in Freelo. Just message him, and he'll give you some advice.
Click on the yellow chat bubble in the bottom right. What a ride!
ToDoo writes...
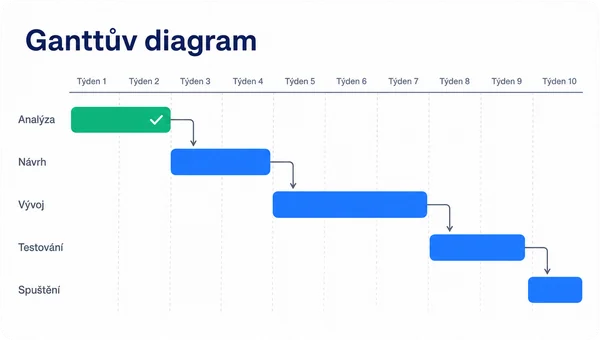
A Gantt chart is a visual timeline of a project. Tasks are represented by horizontal bars: the position and length of the bar indicate when the task begins and ends. This allows you to see at a glance how the project will unfold over time and where tasks overlap.
It is named after Henry Gantt, who popularized it in the early 20th century. Today, manufacturing companies, agencies, and software teams use it to create project schedules.
Creating a Gantt chart involves a few steps:
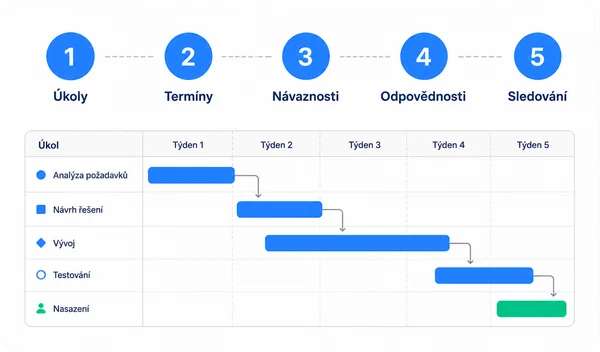
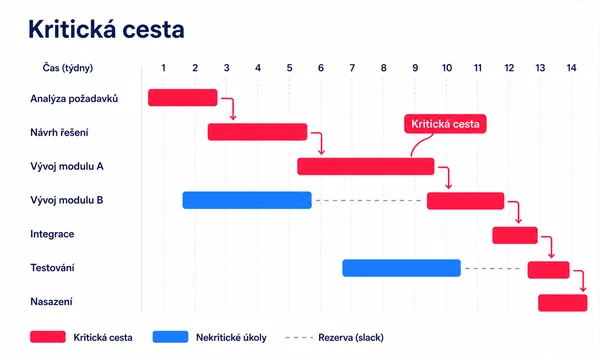
The longest sequence of dependent tasks that determines the shortest possible duration of a project is called the critical path. If a task on the critical path is delayed, the completion date of the entire project is pushed back.
You can also create a Gantt chart in Excel; just color-code the cells according to the deadlines. The problem arises, however, with the first change: shifting a single deadline means manually redrawing the table, and Excel doesn't automatically track dependencies.
In a tool like Freelo, the diagram is linked to tasks: if you move a task, the relationships between tasks remain intact. Excel is good for a one-time sketch, while Freelo is better for a live project that changes over time.
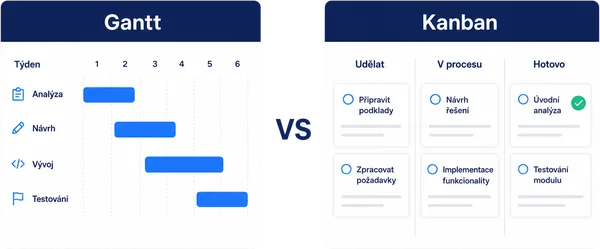
Both show the same work, just from a different angle:
Answers to the most common questions from users who are planning a project over time.
A Gantt chart is used to plan a project over time. It displays tasks as bars on a timeline, along with their due dates and dependencies, so you can see at a glance what’s being done and when, what each task depends on, and whether the project is on schedule. It is mainly used for projects with a fixed deadline, where the steps build on one another.
The easiest way is a project management tool, where the diagram is generated automatically from tasks. For example, in Freelo, you can add due dates to tasks and switch the view to a Gantt chart. You can try it out in the 14-day free trial without a license or formulas. Excel can handle a one-time rough draft, but you’ll have to redraw it manually every time you change a deadline.
Gantt charts show work over time (when each task starts, ends, and what follows it), while Kanban charts show work by status (to do, in progress, done). Gantt charts are for planning a project in advance, while Kanban is for the day-to-day management of ongoing work. In Freelo, these are two views of the same tasks, and you can switch between them with a single click.
No. In Freelo, Gantt is based on the tasks you already have in your project. All you need to do is add a start date and a due date. You don't need to create anything extra, and you can switch the same work back to the list or Kanban view at any time.
The critical path is the longest sequence of consecutive tasks that determines the shortest possible duration of the project. If a task on the critical path is delayed, the deadline for the entire project is pushed back. Tasks outside the critical path have a buffer, so minor delays may not be a problem.
Timeline (Gantt chart) is a feature of of the Business plan. You can try it out with a free 14-day trial without a credit card, and it remains part of the Business plan after the trial ends. You can find it in your project under the Tasks → Timeline tab.
Plánování v Ganttově diagramu je nejpohodlnější na větší obrazovce – Timeline, vazby a hromadné posuny si tam rozložíte líp. Ale samozřejmě se na časovou osu zvládnete podívat i v mobilní aplikaci Freela pro iOS a Android.
Pište na radek.novak@freelo.io nebo volejte +420 778 968 611 (Mon-Fri, 9am-5pm).
Book an appointment online
 START WITHOUT COMMITMENT
14 days free, no credit card required. If it's not right for you, no problem—your account will cancel automatically. If it is right for you, you'll stay with us.

